CVAT Team Performance & Monitoring
How to monitor team activity and performance in CVAT
In CVAT Cloud, you can track a variety of metrics reflecting the team’s productivity and the pace of annotation with the Performance feature.
See:
Performance dashboard
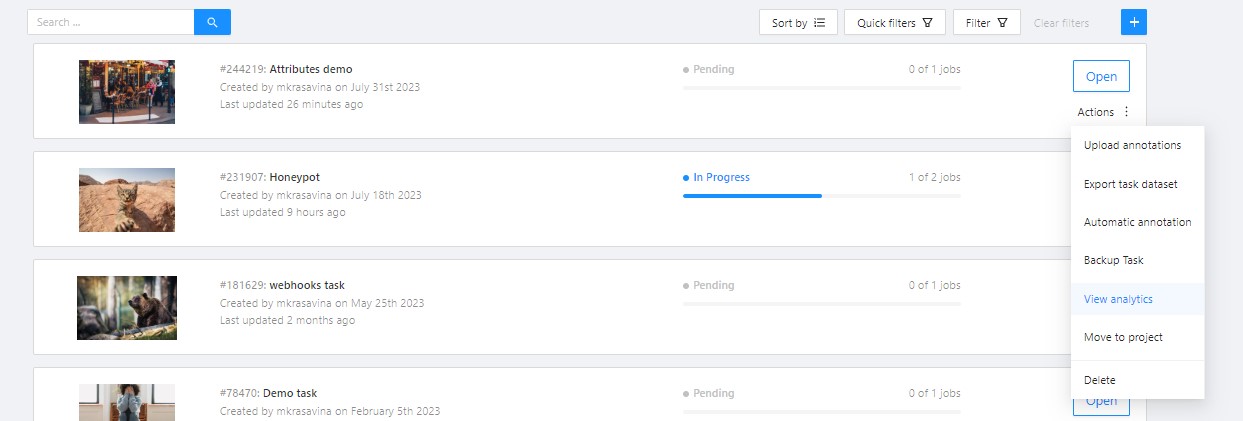
To open the Performance dashboard, do the following:
- In the top menu click on Projects/ Tasks/ Jobs.
- Select an item from the list, and click on three dots (
 ).
). - From the menu, select View analytics > Performance tab.
The following dashboard will open:
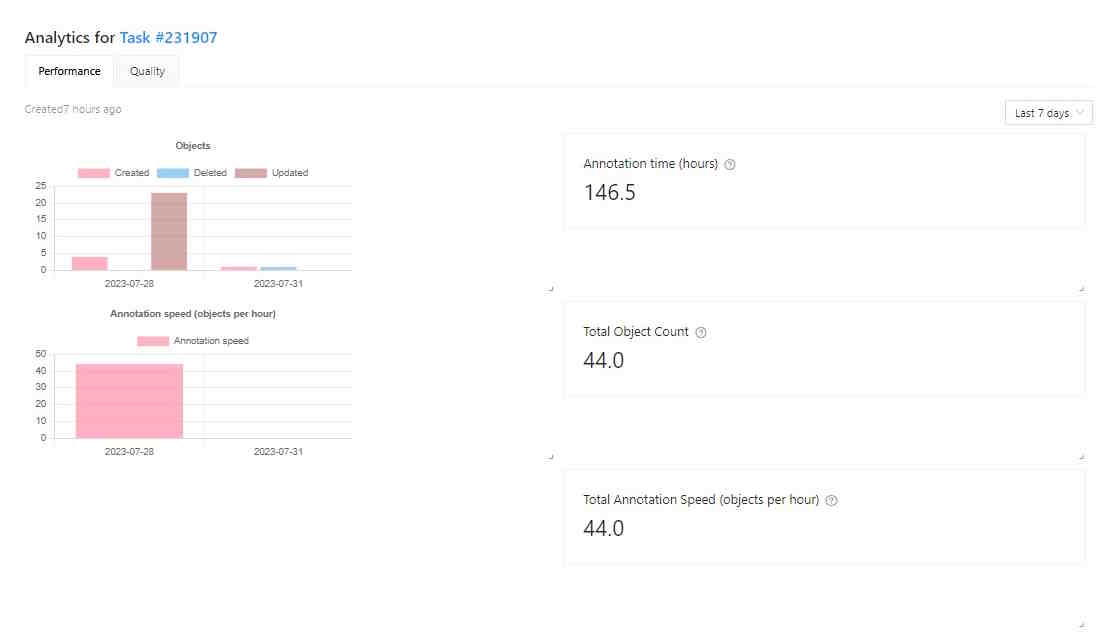
The Performance dashboard has the following elements:
| Element | Description |
|---|---|
| Analytics for | Object/ Task/ Job number. |
| Created | Time when the dashboard was updated last time. |
| Objects | Graph, showing the number of annotated, updated, and deleted objects by day. |
| Annotation speed (objects per hour) | Number of objects annotated per hour. |
| Time | A drop-down list with various periods for the graph. Currently affects only the histogram data. |
| Annotation time (hours) | Shows for how long the Project/Task/Job is in In progress state. |
| Total objects count | Shows the total objects count in the task. Interpolated objects are counted. |
| Total annotation speed (objects per hour) | Shows the annotation speed in the Project/Task/Job. Interpolated objects are counted. |
You can rearrange elements of the dashboard by dragging and dropping each of them.
Performance video tutorial
This video demonstrates the process: